At the outset, I would like to thank Ms. Bhattacharya and State Bank of India for inviting me to speak at this important and eagerly awaited event on the annual calendar. It is a privilege to speak before this august gathering.
In context of the theme of the conference i.e. “Laying the Foundations for India’s Growth”, I would say that there are reasons to be optimistic on several fronts: Growth, inflation, demography, entrepreneurship, democracy, political stability, innovation and establishment’s commitment. There are many eminent speakers & practitioners with better insights and qualification who will speak on some of these issues. However, it is always helpful to also assess possible constraints. The idea is that collective wisdom should be applied to find the most optimal solution. With this objective, I intend to raise few questions for further deliberations during the conference and beyond. For a change however, I would refrain from much spoken area of stressed assets.
(A) Economics of Banking
Since the Conclave is meant for both Bankers and Economists, let me begin with something to engage the Economists.
I have been trying to seek answer to this question for some time now. Few explanations which I came across are:
- The historical average credit multiplier to nominal GDP over FY01-14 is 1.6 x.
(Source: CEIC, DB Research)
- Another model projects credit growth on the basis of GDP growth and inflation as per following equation:
| Credit = 2.36*GDP+ 0.36*CPI or Credit =1.93*GDP + 0.83*WPI |
| (Source: ICICI Bank Research) |
A long run actual relationship between real GDP Growth and bank credit growth is depicted below (Chart 1):
Chart 1: Real GDP Growth 2 and Credit Growth 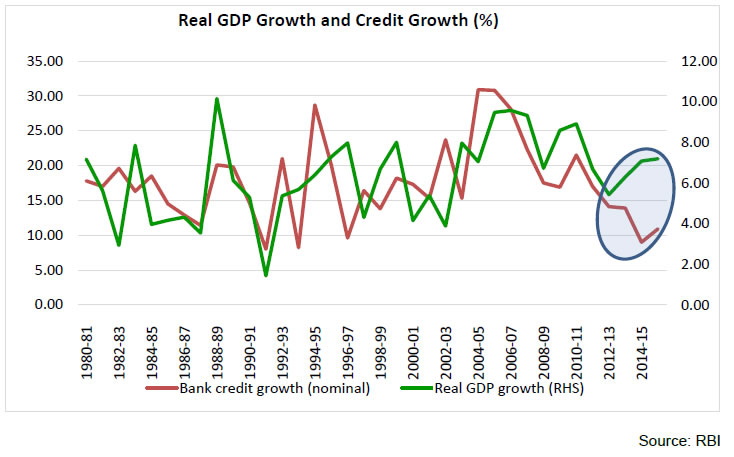 Probably, the link between bank credit and GDP has weakened over the years as banks started accommodating companies through other sources like CPs, bonds, etc. and other non-bank entities also enhanced their share. But still "Banks" remain the main source of finance for the economy. Perhaps the co-relation is more relevant between the banks' total accommodation to companies and real GDP rather than only credit & GDP.
However, the composition of credit to the economy itself has been changing as depicted below (Table 1). While Credit from banking system has gone up by 19.22% between March 14 and March 16, the credit from the non-bank system during the same period has gone up by 37.4%.
| Table 1: Total Credit Deployed – Banks and Non-banks |
| ( in billion) |
| As at the end |
Outstanding |
Credit from Non-Bank System/% share |
Banking System |
Total |
| Loans of NBFCs |
Loans of HFCs |
Corporate Debt instruments |
Commercial Papers |
External Commercial Borrowings |
| Mar-14 |
4918.64 |
4639.42 |
14673.97 |
1066.10 |
7965.52 |
33263.65 |
61006.95 |
94270.6 |
| Mar-15 |
6070.79 |
5623.15 |
17503.20 |
2561.20 |
8337.89 |
40096.23 |
66900.45 |
106996.7 |
| Mar-16 |
7469.93 |
6811.18 |
20192.96 |
2602.40 |
8615.68 |
45692.15 |
72732.03 |
118424.2 |
| Source: Supervisory Returns (RBI & other regulators) |
Then, do we see any co-relation with the total credit supply rather than bank credit alone? (Yes/ No/ May be)
Added Complications
-
Trade credit plays an important role but not captured in a similar way as other components
-
Double count in respect of NBFCs/HFCs
-
Migration from GDP to GVA may make it more difficult to analyse past trends and establish new benchmarks at least in initial few years
A more stable multiplier of real GDP and bank credit may emerge in the medium term once:
-
banks come out of the stressed assets worries and have more risk appetite
-
private investment sentiment improves on a sustainable basis (creating higher demand for project finance) and,
-
inflation falls on a durable basis giving rise to lower lending rates
Obviously, an efficient credit supply strategy would be handicapped in absence of reasonably accurate demand estimation. I urge the economists present here to work towards possibilities of modeling such a co-relation.
(B) Supply Side of Credit
Broadly accepted estimations place credit growth need in the range of 12 to 15% to support the projected growth in the intermediate term.
Questions to ponder over:
-
Resources to support credit growth while being mindful of Asset- Liability mismatches
-
Capital needed- Quantum & Composition (CET1/Tier I/Tier II)
-
Economic priority of the segment needing credit vis-à-vis bankers’ inclination to follow that priority
i) Resources
Gross domestic savings (Table 2) and trend in growth in bank deposits (Table 3) are depicted below:
| Table 2: GROSS SAVINGS |
(% of GNDI)
| Item |
2011-12 |
2012-13 |
2013-14 |
2014-15 |
| Gross Savings |
33.8 |
33.0 |
32.3 |
32.3 |
| Household sector |
23.0 |
21.9 |
20.5 |
18.7 |
| Net financial saving |
7.2 |
7.2 |
7.5 |
7.5 |
| Saving in physical assets |
15.5 |
14.4 |
12.7 |
10.8 |
| Saving in the form of valuables |
0.4 |
0.4 |
0.3 |
0.3 |
| Note: Net financial saving of the household sector is obtained as the difference between gross financial savings and financial liabilities during the year. |
| Source: CSO. GNDI: Gross National Disposable Income |
Key observations:
-
Decline in Household savings
-
Stagnant net financial savings
-
Household indebtedness increasing
| Table 3: Growth Rate of Bank Deposits |
| (in %) |
| Bank Group |
PSBs |
PvtSBs |
Foreign Banks |
All Banks |
| Mar-12 |
13.1 |
16.8 |
15.1 |
13.8 |
| Mar-13 |
14.0 |
18.5 |
3.9 |
14.4 |
| Mar-14 |
13.1 |
14.2 |
22.4 |
13.7 |
| Mar-15 |
8.9 |
16.5 |
15.0 |
10.7 |
| Mar-16 |
4.6 |
17.3 |
13.2 |
7.6 |
Key observations:
-
Rate of growth of bank deposits has slowed down considerably especially in PSBs.
-
In short run, any gap in deposit growth can be funded by leveraging excess SLR, however, financial savings need to strengthen in the medium to long term
-
ALM trend: A gradual increase in institutional saving is also probably contributing to shrinking liability duration while the assets duration is expanding due to long term funding by banks.
ii) Capital Requirements
| Table 4: Capital Adequacy of Banks |
| Bank/Bank Group Name |
Period |
Public Sector Banks |
Private Sector Banks |
Foreign Bank Group |
Scheduled Commercial Banks |
| CRAR |
31-Mar-15 |
11.44 |
15.73 |
16.81 |
12.96 |
| 31-Mar-16 |
11.82 |
15.68 |
17.08 |
13.32 |
| CET I Capital Ratio |
31-Mar-15 |
8.26 |
12.77 |
15.55 |
10.01 |
| 31-Mar-16 |
8.66 |
13.11 |
15.9 |
10.49 |
| Tier I Capital Ratio |
31-Mar-15 |
8.73 |
12.8 |
15.57 |
10.33 |
| 31-Mar-16 |
9.13 |
13.16 |
15.92 |
10.81 |
| Tier 2 Capital Ratio |
31-Mar-15 |
2.72 |
2.93 |
1.25 |
2.64 |
| 31-Mar-16 |
2.68 |
2.52 |
1.16 |
2.51 |
Overall capital position in the banking systems appears adequate at present; however, few banks could be near the minimum prescribed threshold levels going forward. This is on account of many moving components as under:
-
Supporting RWA Growth for normal growth
-
Provisioning Requirements (as explained below)
-
Basel Framework (CCB, D-SIBs etc.)- As per agreed framework
-
Large Exposure Norms- Guidelines issued recently
-
Enhanced Market Risk –Credit enhancements to corporate bonds and increased derivatives portfolio would entail higher market risk capital charge
-
Higher Operational Risk – Recent episodes of KYC/AML violation, Cyber/FinTech related security incidents have heightened operational risk for banks
-
Pension Funding- Gaps could still be there
-
IFRS – Fair value treatment would potentially enhance capital requirements for banks
Provisioning Requirements
Substandard, Doubtful and Loss advances constitute nearly 36%, 59% and 5% respectively of the stock of non-performing assets (Rs. 611 thousand crore) of the banking system as on March 2016. Though, I won’t like to hazard a guess about the provisioning numbers due to the dynamic nature, nevertheless due to ageing of non-performing assets and migration of a certain percentage of standard assets to NPA category, the system as a whole could be looking at significantly higher incremental provisioning requirements in coming year. Though a better recovery and up-gradation in existing NPAs can support through provision reversal, the expected provision would still be significant. This is against a Total Earning before Provision and taxes of Rs. 2,46,067 for the sector as at the end of March 16. Incidentally, there is considerable divergence between the earnings of different bank groups as can be seen from the Table 5 below:
| Table 5: Earning Before Provisions & Taxes |
| (in Rupees crore) |
| Period |
Public Sector Banks |
Private Sector Banks |
Foreign Banks |
Scheduled Commercial Banks |
| 31-Mar-15 |
139,159 |
69,850 |
25,192 |
234,200 |
| 31-Mar-16 |
137,151 |
84,378 |
24,537 |
246,067 |
| Source: OSMOS returns, RBI |
Other potential factors with a bearing on capital requirement:
- Sovereign Risk Exposure (Risk Weight on Sovereign Bonds)
This is a very live issue with standard setting bodies. Even if a low 2% and 5% Risk Weight respectively on the bank holdings of Central and State Government securities is assumed, the banking system may be required to hold around Rs. 6000 crore of capital on this count alone.
While we are resisting the proposals during negotiations, the state governments have to be extremely cautious as any irresponsible act on their part could have repercussions both for our arguments and also for instruments that can be treated as eligible under LCR framework.
Discussion in the international forum is veering towards penalizing industries which add to carbon emissions and banks may be forced to hold additional capital for loans to such industries on account of increased risk weights.
Key takeaways:
-
Every bank should estimate its own requirement of capital under different scenarios including past average trend of slippages, recovery and up-gradation.
-
They should carefully weigh optimum mode of raising capital and the extent to which it can be raised.
-
This should enable them to better design their business strategy and in setting the risk appetite.
-
I am not sure if this exercise is being done with full elaboration & scenario building as part of the present ICAAP exercise.
(C) National Priorities
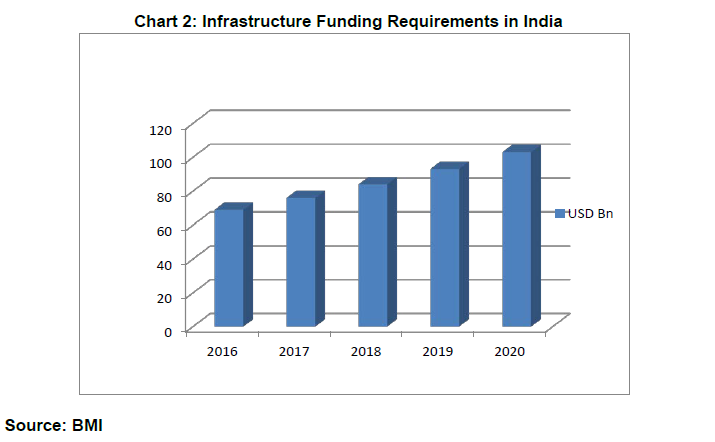
a) Infrastructure
12th Five Year Plan (2012-17) projected an investment of Rs 55.74 lakh crore in infrastructure with banks expected to meet 23% of this requirement. Though, there is still some time to go before the end of the plan period, apparently, the investment target as well as bank credit may fall short of the projection.
Assuming the current pace of credit growth & that the banks continue to meet 23% of the infrastructure funding needs of the country between 2016 and 2020, they may be required to lend between 17 and 26% of their total incremental bank credit to the sector. This raises few issues:
-
Who can avail the infra credit going forward? Till recently, a handful of promoter groups have captured the infrastructure sector and majority of them seem to be “retired hurt”.
-
Even if new players were to come, whether the banks are equipped (both by way of resources and capital) and willing to lend them within the existing models.
-
Whether external flow can support major part of the infrastructure funding requirements and if yes, whether the necessary enablers are in place.
b) Agriculture
-
As per the 2011 Agriculture Census,
- 60 per cent of the population depends on agriculture
- sector provides employment to 55 per cent of the work force
- contribution of agriculture to the national GDP is around 17%
- No. of farmers holding marginally sized land has increased substantially from about 36 million in 1970-71 to 93 million in 2010-11 highlighting the continuous fragmentation of lands which discourage mechanization, lower labour productivity and increase costs.
-
35% of the agricultural households having less than 1 acre of land, another 35% holding between 1 and 2.5 acres, and only 30% households with land more than 2.5 acres.
-
80% borrowing of large farmers (>10 hectares) is from institutional sources, however, only 15% of the landless farmers receive finance from formal sources
-
The land under agriculture has been practically constant at around 140 mn hectare over past 4 decades with less than 50% being irrigated
| Table 6: Agriculture Loan outstanding |
| (No of A/cs in actual & Amount in crore) |
| |
Crop loan |
Term loan |
Total |
| Year |
No. accounts |
Amount Outstanding |
No. accounts |
Amount outstanding |
No. accounts |
Amount outstanding |
| 2014 |
39049508 |
397718 |
11766229 |
179048 |
50815737 |
576766 |
| 2015 |
43209609 |
471888 |
11966785 |
175133 |
55176394 |
647021 |
| 2016 |
46854333 |
542458 |
11952483 |
175715 |
58806816 |
718173 |
- While credit flow to agriculture sector has increased over the years, the long term credit in agriculture or investment credit has shown a declining trend. With no additional factors contributing to enhance the credit absorption capacity of this sector, there is a need to take a look at how incremental credit is being put to use.
Few other issues in the farm sector worth noting:
-
New generation is not similarly interested in farming and is inclined to migrate to cities.
-
Though many efforts are underway in form of improvement of rural road infrastructure, e-connectivity, direct benefit transfers, provision of power connectivity, water-bodies for irrigation, agriculture insurance etc. only the incremental measures may not be sufficient to improve the state of agriculture in the country.
-
Attempts must be made to target the entire agriculture value chain financing rather than on a solo level.
-
Further, the PSBs need to take a hard look at their approach for posting their staff in rural areas. Currently, there is a very high turnover in the staff in rural branches which hampers a focused approach.
c) MSME
-
12th Five Year Plan (2012-17) highlighted a credit gap of 56 per cent in the MSME (micro, small and medium enterprises) finance sector in India. In absolute terms, this translates to approximately Rs. 16 trillion which is roughly 25 % of the total bank credit.
-
Outstanding credit to the MSE sector of all scheduled commercial banks as on March 31, 2016 has shown a declining trend.
-
RBI, in co-ordination with the Government of India and other stake holders has initiated several measures to enhance flow of credit to the sector.
-
Banks need to employ smart technology and innovative credit scoring to meet the credit needs to especially the micro and small segment a large % of which are outside the formal financial system.
-
In the process, however, the banks must guard against creating over indebtedness in the sector.
(D) Human Resources
Finance alone cannot ensure growth. Banking is still far away from being a driverless car, hence human factor is crucial.
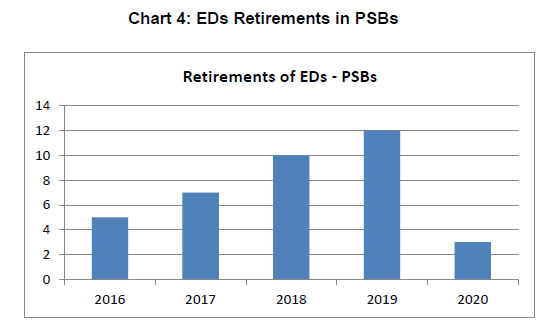
(i) Public Sector Banks
• More than 73% staff in DGM/GM cadre is above 55 years of age, while another 23% are between 50 and 55 years.
(ii) Private Sector Banks are witnessing very high rates of attrition at lower levels hence low customer connect and acute performance pressure may result in mis-selling. This area also needs urgent attention of the Top Management.
(E) Concluding thoughts:
I would like to end with a Chinese proverb which says, “The best time to plant a tree was 20 years ago and the second best time is now.” The sector would do well not to miss planting trees at the second best time.
Thank you!
|